LOOPS Show and Tell
Wednesday, Feb 25, 2009, 2PM EST
This page is the planning document for the February 25, 2009 LOOPS internal Show and Tell.
We've integrated a collection of our work on LOOPS into a PAS project called: Spring 2009 Motion and Forces (PAS)
Outline
- Sign in as the loopsteacher
- Select the class LOOPS Test Class 200902
- Open the Teacher dashboard report for LOOPS Test Class 200902
- Select which students work will be shared with the class
- Optional add activities to this class
- Run this project as one of the default students
- Run the Polling Test activity as a student
Sign in as the loopsteacher
Sign in with the following teacher account on the LOOPS staging portal: http://loops.portal.dev.concord.org/
| username | password |
|---|---|
| loopsteacher@concord.org | loopsteacher |
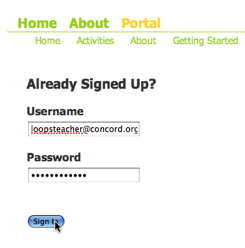
As the user: loopsteacher@concord.org you can can preview the activity, examine the class list and start a primitive LOOPS Teacher Dashboard by starting the report jnlp link.
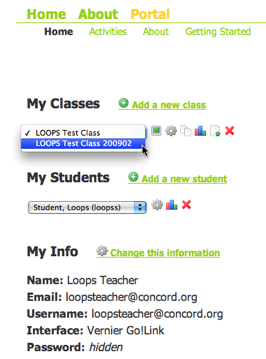
Select the class LOOPS Test Class 200902
On the teacher home page select the LOOPS Test Class 200902 class:
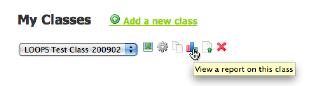
Open the Teacher dashboard report for LOOPS Test Class 200902
Open the LOOPS Test Class 200902 dashboard report page:
- click on the small multi-colored bar graph icon to open the Report page.
- click on the small multi-colored bar graph icon under the Activity titled: Spring 2009 Force and Motion (PAS). Clicking on one of the green checkmarks will open the project and load that workgroups data however no changes will be saved.
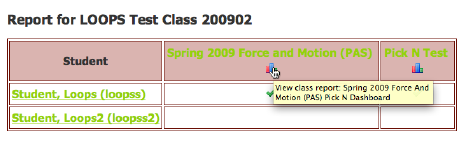
Currently this Dashboard/Report only implements the FlagN interface for Activity 4: To the Beach!
Select which students work will be shared with the class
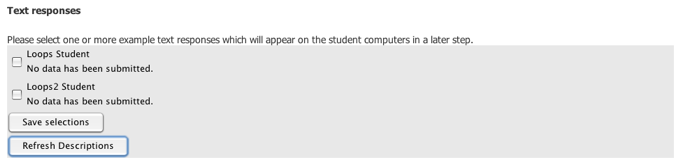
The FlagN feature allows the teacher to view all the open text responses and graphs annotations that students have created and then select which ones will be shared with the whole class.
Before any students have responded the display of the open text response looks like this:
After a student enters data and either clicks the Submit Data button or navigates to another page:
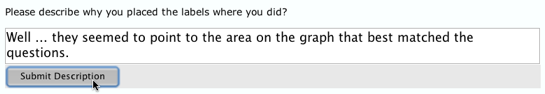
The teacher can click the Refresh Descriptions button to view the new data.

This is how the a selectable list of student graph annotations are displayed.
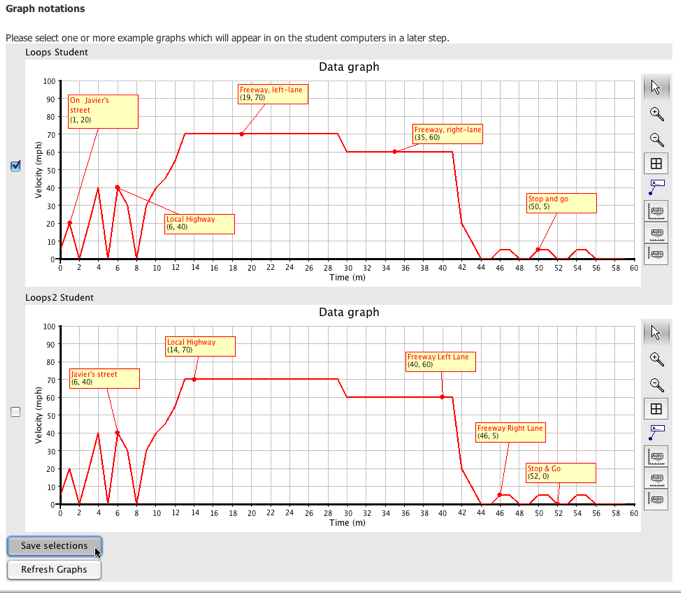
After selecting the graphs using the checkboxes on the left click the Save Selections button in the lower right to update what will appear on the student pages.
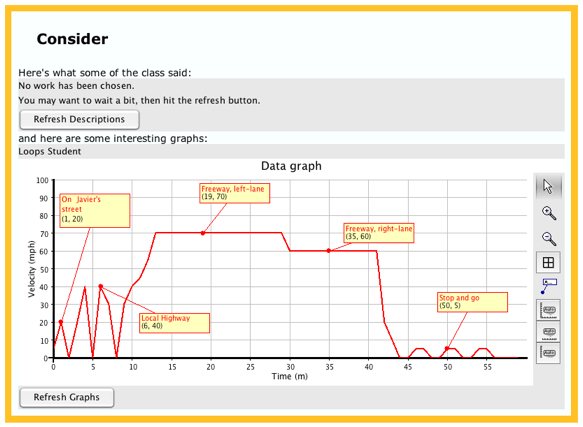
If the teacher doesn't select any of the text responses and only one graph response here's how that might appear for the students:
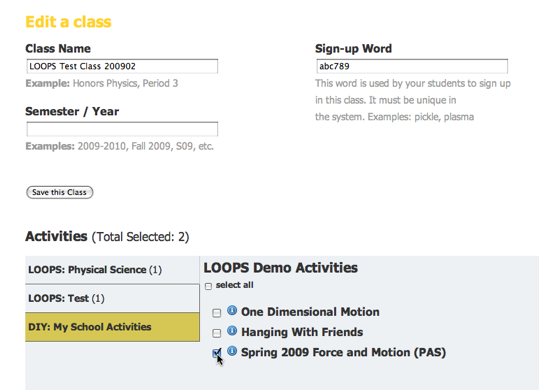
Optional add activities to this class
Activities can be added to the class by editing the class:
Run this project as one of the default students
The activity can be also be run by logging in as a student at the loops staging portal.
Note: If you are testing this by running as both a teacher and a student login to the LOOPS staging portal with a different browser for the teacher and the student.
There are two default students registered for the LOOPS Test Class 200902 class:
| username | password |
|---|---|
| LoopsS | loops |
| LoopsS2 | loops |
You can also register as a student and use this class sign up word to become a student in this class: abc789.
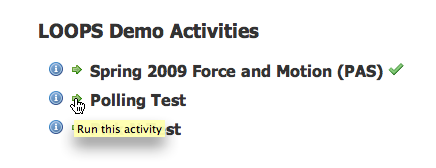
Run the Polling Test activity as a student
The Polling Test Activity demonstrate the initial version of a Poll where on one page students answer a multiple choice question and on another page the aggregate data from all students is displayed in a bar graph.
This activity is the first test of the new Polling functionality and is not designed to have a great deal of pedagogic value yet!
After you sign in as a student in this class start the Polling Test Activity:
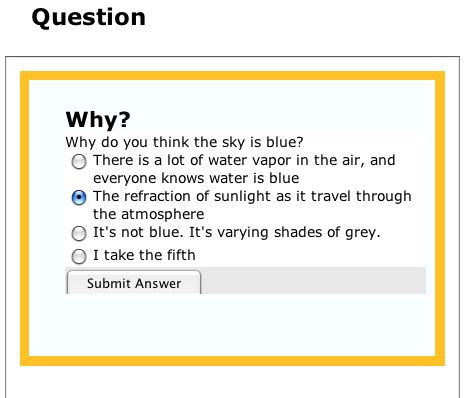
Here's how the Question appears:
Here's the initial aggregate form of the display.
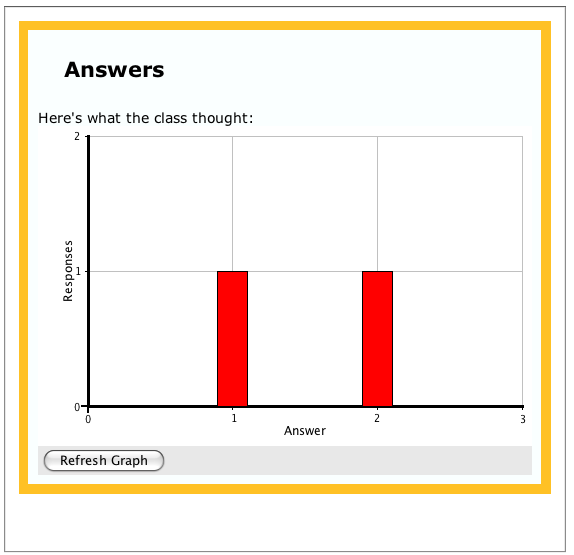
There are many improvements that can be made.